
Prometheus
Prometheus 是由德国公司 SoundCloud 音频流媒体服务平台使用 Go 语言开发的开源系统监控和告警工具包,首个版本发布于 2012 年,使用 Apache License 许可;
2016 年,Prometheus 加入了 云原生计算基金会(CNCF) 作为托管项目。
主要特性
- 内置一个时序存储(TSDB, time series database)
- 支持一个由指标名称(metric)和键/值(key-value)对标识的时间序列数据的多维数据模型
- 支持灵活查询语言 PromQL
- 语法
函数名{key1=value1, key2=value2, ...}
- 语法
- 通过 HTTP pull 模型采集时序数据
- prometheus server 发起 HTTP 请求到 被采集实例 metrics HTTP 服务查询( node_exporter 默认
http://localhost:9100/metrics) - node_exporter 中 node 是指被采集实例节点
- prometheus server 发起 HTTP 请求到 被采集实例 metrics HTTP 服务查询( node_exporter 默认
- 主流服务和组件都有现成 explorer
架构图
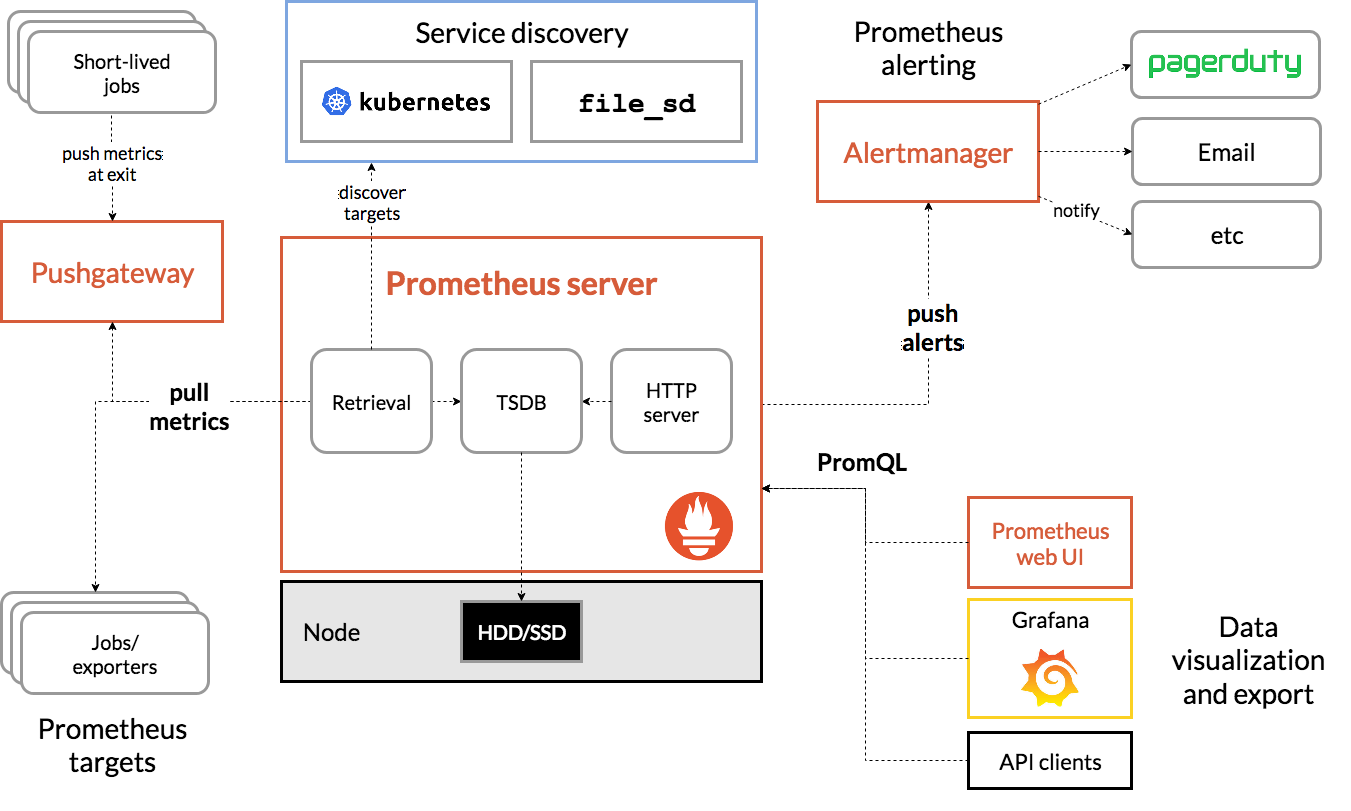
注:它不适用于需要存储严格精确数据,如用于账单对账。
安装
容器安装
docker pull prom/prometheus:v3.6.0
export PATH_ETC=/v/etc/prom/
export PATH_DATA=/v/data/prom/

mkdir -p $PATH_ETC
mkdir -p $PATH_DATA

docker run \
-d \
--restart unless-stopped \
--name prome \
-p 19090:9090 \
-v $PATH_ETC/prometheus.yml:/etc/prometheus/prometheus.yml \
-v $PATH_ETC/web.yml:/etc/prometheus/web.yml \
-v $PATH_DATA:/prom \
prom/prometheus:v3.6.0 \
  --web.listen-address=0.0.0.0:9090 \
  --web.enable-lifecycle \
  --config.file=/etc/prometheus/prometheus.yml \
  --storage.tsdb.path=/prom
macOS 二进制安装
wget https://github.com/prometheus/prometheus/releases/download/v3.0.1/prometheus-3.0.1.darwin-arm64.tar.gz

tar -zxf prometheus-3.0.1.darwin-arm64.tar.gz
cd prometheus-3.0.1

./prometheus --config.file=prometheus.yml --web.listen-address=0.0.0.0:19090 --web.enable-lifecycle
校验服务是否正常 curl http://localhost:19090/query
监控虚拟机实例
测试环境: Ubuntu 24.04
在要监控的 Linux 实例上安装 node_exporter , 两种方式
- a. 通过 systemd 方式安装和自启动
- b. 通过 安装 docker-ce 服务提供 docker 运行环境,在安装一个 node_exporter 容器实例
b 方式 手动执行安装 node_exporter 容器实例
docker run -d \
  --restart unless-stopped \
  --name node_exporter
  --net="host" \
  --pid="host" \
  -v "/:/host:ro,rslave" \
  quay.io/prometheus/node-exporter:latest \
  --path.rootfs=/host
参数说明:
--net指共享宿主网络,如果不可用时,可使用-p 9100:9100指定映射端口代替;-v参数rslave选项在 macOS 上不可用,可去掉;
校验 node_exporter 安装是否成功和 metrics path 是否正常 curl http://localhost:9100/metrics
修改 prometheus 的 prometheus.yml 配置文件:
# my global config
global:
  scrape_interval: 15s # Set the scrape interval to every 15 seconds. Default is every 1 minute.
  evaluation_interval: 15s # Evaluate rules every 15 seconds. The default is every 1 minute.
  # scrape_timeout is set to the global default (10s).

# Alertmanager configuration
alerting:
  alertmanagers:
    - static_configs:
        - targets:
          # - alertmanager:9093

# Load rules once and periodically evaluate them according to the global 'evaluation_interval'.
rule_files:
  # - "first_rules.yml"
  # - "second_rules.yml"

# A scrape configuration containing exactly one endpoint to scrape:
# Here it's Prometheus itself.
scrape_configs:
  # The job name is added as a label `job=<job_name>` to any timeseries scraped from this config.
  - job_name: "prometheus"

    # metrics_path defaults to '/metrics'
    # scheme defaults to 'http'.

    static_configs:
      - targets: ["localhost:9090"]

  # 新增一个要采集的 exporter 目标实例
  - job_name: "my-web"
    static_configs:
      - targets: ["10.0.0.1:9100"]
prometheus 重载配置 curl -XPOST -u admin:secret http://localhost:9090/-/reload
打开 prometheus query 页 http://localhost:9090/query 输入 PromQL node_load1{} 查询,确认采集是否正常。
配置 grafana 仪表板
- 新增 data source - prometheus ;
- import dashboard 输入 ID 1860 生成 Node Exporter Full 页 ;
- 在 Node Exporter Full 过滤
Job=my-web校验仪表是否正常 ;
常用配置
修改 网页服务 默认监听 HTTP 地址和端口 --web.listen-address=100.0.0.1:9090
支持通过 HTTP 请求触发 reload
启动时带上启用 Lifecycle API 特性参数 ./prometheus --config.file=prometheus.yml --web.enable-lifecycle ; 重载 curl -XPOST -u admin:secret http://localhost:9090/-/reload 。
配置 HTTP basic 认证
生成密码 secret 对应 hash 值 https://prometheus.io/docs/guides/basic-auth/#hashing-a-password
在线生成密码 https://bcrypt-generator.com
生成 web.yml 配置文件:
cat << EOF > web.yml
basic_auth_users:
  admin: $2a$12$w.Clm7ccDI0ojUL2Gacf5.aktlMrzjkXFigCyDySW6Kr8Uk2Tvbcu
EOF
重启服务 ./prometheus --config.file=prometheus.yml --web.config.file=web.yml
校验 curl -u admin:secret http://localhost:9090
自定义 label
https://stackoverflow.com/questions/49829423/prometheus-add-target-specific-label-in-static-configs
实现告警
另见 alertmanager
常用 explorer 列表
- node_exporter Exporter for machine metrics, for Linux and macOS
- windows_exporter Prometheus exporter for Windows machines
- blackbox_exporter Blackbox prober exporter for HTTPS/TCP/gRPC
- cadvisor / container
- postgres_exporter
- elasticsearch_exporter
- redis_exporter
| exporter | port |
|---|---|
| node-exporter | 9100 |
| windows_exporter | 9182 |
| cadvisor | 8080 |
| postgres_exporter | 9187 |
| elasticsearch_exporter | 9114 |
| redis_exporter | 9121 |
See also